How To Get Cipher Indicators For Free and Use Them To Crush The Market
The 3 of the most coveted indicators for crypto are now live on Aurox.. For FREE! These indicators cost a whopping $1500 for a lifetime license, but we’re making them completely free to use!
There is a lot to cover in this article, but pay attention, as these indicators can do a lot of the grunt work for you. They can help predict divergences, trends, and give you an edge when trading.
Shout out to one of our Aurox users, CryptoChrispy, for creating this incredible guide
Sign up For Aurox and Get This Indicator For Free Plus Hundreds Of Other Functions
How To Access Cypher Indicators
Simply visit Aurox (https://web.getaurox.com) and follow the quick video below.
Cypher A
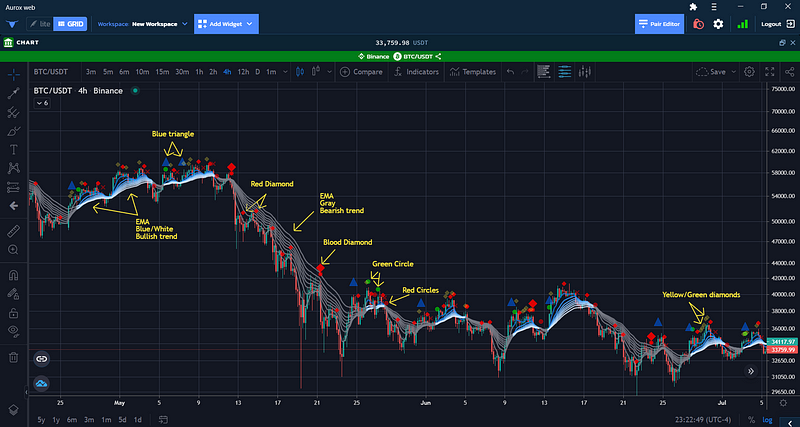
Cypher A is comprised of 8 different EMA ribbons. These ribbons change color based on the trend of the market. Cipher A also has multiple symbols that populate on the candle stick chart to give a visual cue of what could happen in the market.
- EMA Ribbon: 8 different EMA values, editable to your choosing. In its default settings, the ribbon color shows what trend we are in. - Blue or White = bullish
- Grey = Bearish - Yellow/Green Diamond: bullish continuation
- Red Diamond: trend weakening.
- Green Circle: bullish indicator, if followed by a yellow/green diamond, a breakout is possible.
- Red X: Bearish indicator, if followed by a red diamond, a breakdown is possible.
- Blue Triangle: Trend reversal indicator, momentum is decreasing, and a reversal is near
- Blood Diamond (large red diamond): Bearish indicator, if paired or followed with a red x or smaller diamond, a break downward is likely.
Cipher A looks great visually, however… Cipher B is where you really make most of your trades from.
The two best parts from Cipher A:
- Blue triangles to prepare for a reversal. If you see this, make sure you have your stop losses set.
- EMA ribbon to help detect trends. Hint: disabling all ribbons except 4, 5, and 6, still allows us to see the trend without the chart being too busy.
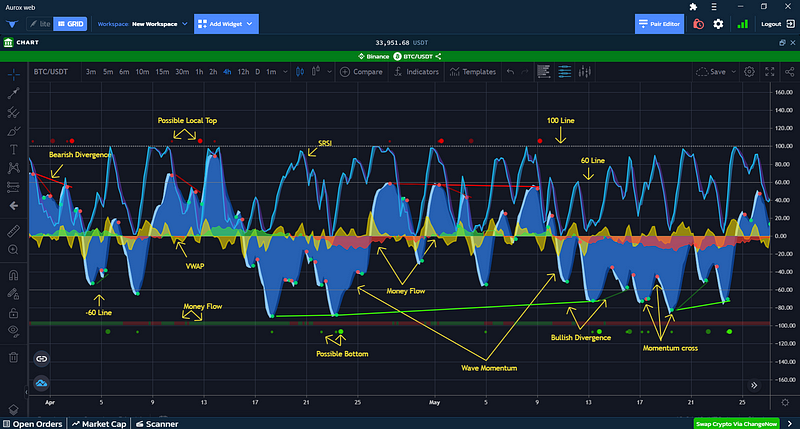
Cypher B
Cipher B is a combination of multiple oscillators in one. There are multiple waves to pay attention to.
At first look, this can look very chaotic and confusing, but let’s break things down one by one.
- Blue waves: Momentum waves.
- Commonly used as a primary indicator - Red and green dots (on waves): wave/RSI crosses
- Red = price is currently moving lower
- Green = price is currently moving higher
- Used as entry and exit points - Green and red lines on waves: hidden divergences.
- Assist with the blue wave trading strategy - Floating Dots above/below blue waves.
- Green = local bottom, look for additional buy indications
- Red = local top, look for additional short indications - Yellow Waves: Volume Weighted Average Price (VWAP)
- Commonly used as a primary indicator, especially on shorter time frames - Green and red waves: Money flow indicator.
- Green Money flowing in
- Red money flowing out
- Can be used as a standalone indicator, can be used with VWAP. - Blue/Purple line: Stoch RSI
- Not necessary and can be disabled. We will discuss this in this guide, but we do not personally use them for the main strategies.
- When the Stoch RSI is low, and crosses to go up (turn blue), you buy.
- When the Stoch RSI is high and crosses to go lower (turn purple), you sell.
- Simple and can work as its own strategy. - Please Note: Some of the triggers above are based on lagging indicators such as RSI divergences. That means some of these dots and triggers will not display live but rather 2 intervals back. This does not mean that it’s “repainting”, it’s simply because certain indicators are lagging indicators. Action can still be taken on lagging indicators. It should not impact the main strategies outlined below.
Blue Momentum Waves
For this indicator, you are looking for three waves in total:
- Wave One and Two on the same side of the Zero line.
- The Gap between the two waves on the other side of the Zero line.
- Waves below the Zero line indicate a long.
- Waves above the Zero line indicate a short.
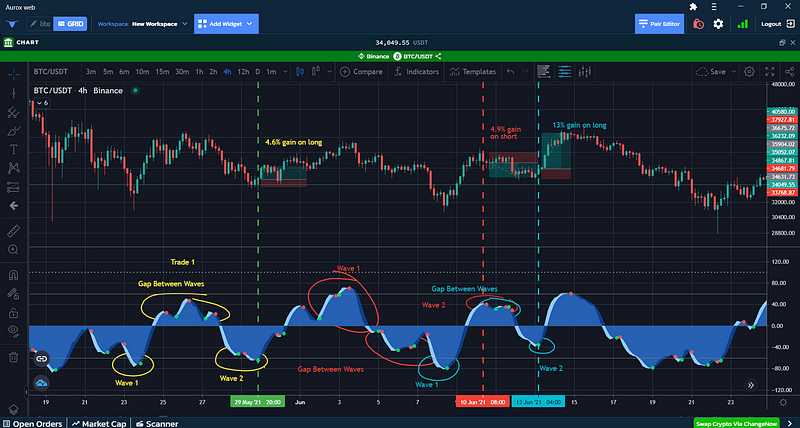
You can see how this indicator works in the three trades above.
Rules for this strategy:
The first wave must be bigger than the second wave (the wave that follows the gap) to enter a position.
This is not always true, and sometimes you could take a position without all three waves, but it isn’t the safest method. Example would be Wave 1 in Yellow circled above. The far-left part of the blue wave could have been your first indication, and then the green dot circled could have been your entry position for a long. This works in some instances, but not all. That is why we typically look for a gap.
Example Trades From Above
Trade 1
We took a long on trade 1, denoted by the yellow on the chart above. The reason for this trade are as follows:
- Wave 1 — Large blue wave below the zero line.
- The Gap — A blue wave above the zero line on the other side.
- Wave 2 — Blue wave on the same side of the zero line as the first wave.
Entry Position: You are looking for the white part of the wave, to cross the blue part of the wave (indicated by the green dot).
Stop Loss: This should be the support just prior to this move.
Exit: You should be looking at the next wave above the zero line, when the white crosses the blue on the wave (indicated by the red dot).
Note: This trade could have been skipped due to the head and shoulders present. In these situations, use your own due diligence and experiences to decide whether to enter the trade.
Trade 2
We took a short on trade 2, denoted by the red on the chart above. The reason for this trade are as follows:
- Wave 1 — Large blue wave above the zero line
- The Gap — A blue wave gap below the zero line
- Wave 2 — Blue wave on the same side of the zero line as the first wave.
Entry Position: When the white crosses the blue on the wave (indicated by a red dot).
Exit: You should be looking at the next wave below the zero line, when the white crosses the blue on the wave (indicated by the green dot).
Trade 3
The same exact concept applies to this as Trade 1. In this trade, the gap for Trade 3 was also involved as Wave 2 in Trade 2. Depending how active you are trading, you could use waves back to back if they meet the trade criteria
In the sections below we’ll discuss some of the additional indicators available in Cyper B that can enabled, or disabled.
Red and Green Floating Dots
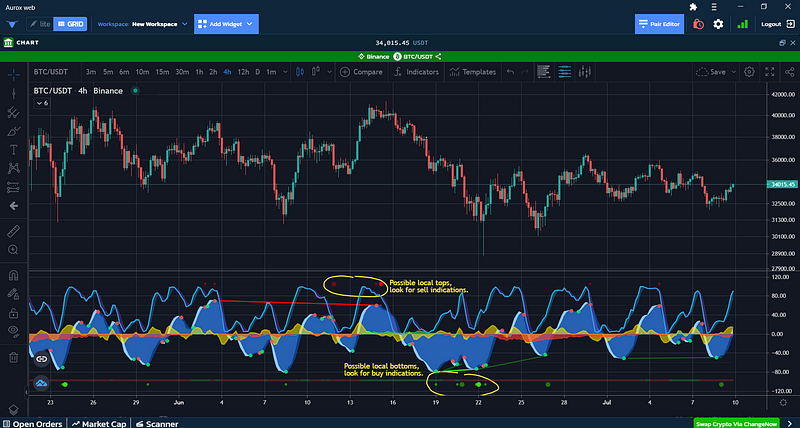
- The Floating Red Dots above the zero line denotes when a local top is created.
- The Floating Green Dots below the zero line denotes when local bottoms are created.
In these situations, you want to start looking for another indication to enter the market.
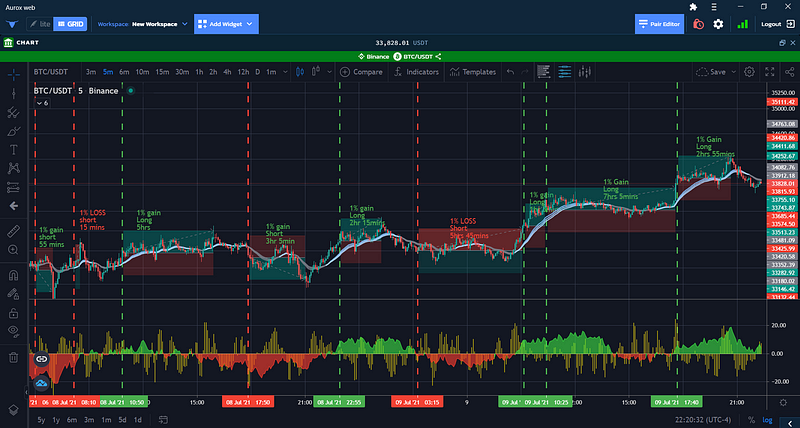
Volume Weighted Average Price (VWAP)
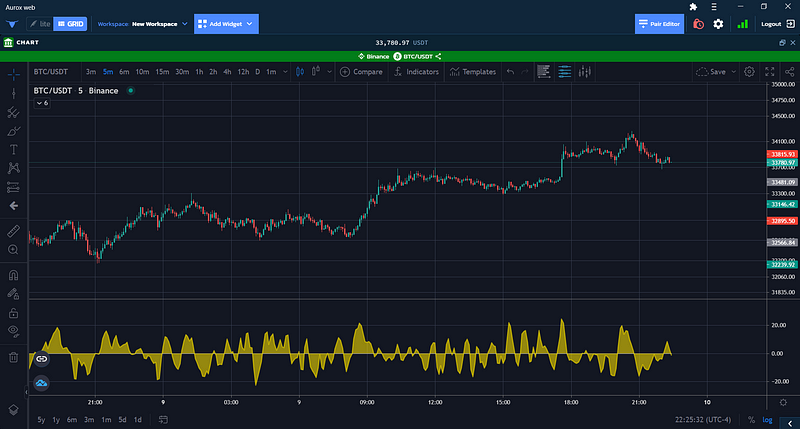
The VWAP indicator has been most successful on shorter time frame trades when you’re able to spend a decent amount of time day trading.
Switch the VWAP indicator from waves to columns for a better visual of which direction it is going, and when it breaks the zero line. This is illustrated below in the following trade examples of how you can utilize VWAP. As you can see, there are a lot of trades taken and that is why it can require a bit of your time.
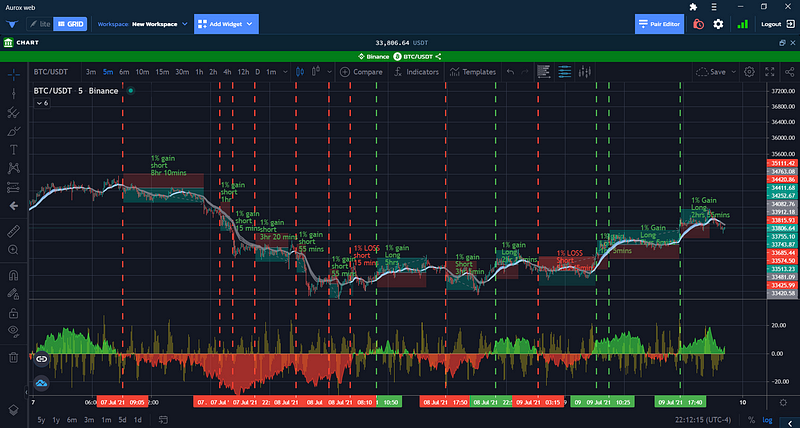
This backtest illustrated above is based on day trading on the 5-minute chart consistently.
Red vertical dotted lines indicate it was a short entry, green a long entry.
Other indicators used in conjunction with the VWAP:
- Cipher A’s EMA ribbons
- Cipher B’s Money Flow Indicator
In this test, the risk/reward was 1:1 with a 1% take profit and stoploss.
Rules:
- Only enter a short when…
- The money flow indicator is red.
- The VWAP is confirmed (2 candles) below the zero line.
- The EMA ribbon is grey (bearish). - Only enter a long when…
- The money flow indicator is green.
- The VWAP is confirmed (2 candles) above the zero line.
- The EMA ribbon is blue/white.
Results: 14 trades
- 12 trades were successful with the 1% gain.
- 2 trades were unsuccessful and were stopped out at 1% loss.
Here is a little closer view of some of the trades.
Money Flow Indicator
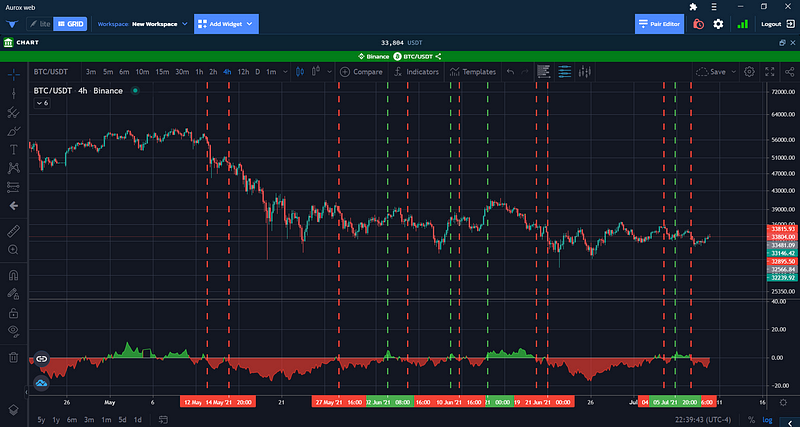
This indicator is useful on any timeframe, and simply measures the amount of money being transacted.
- Green = money flowing in.
- Red = money flowing out.
As seen in the above and below images (4hr and 15 min charts) this indicator can be used by itself.
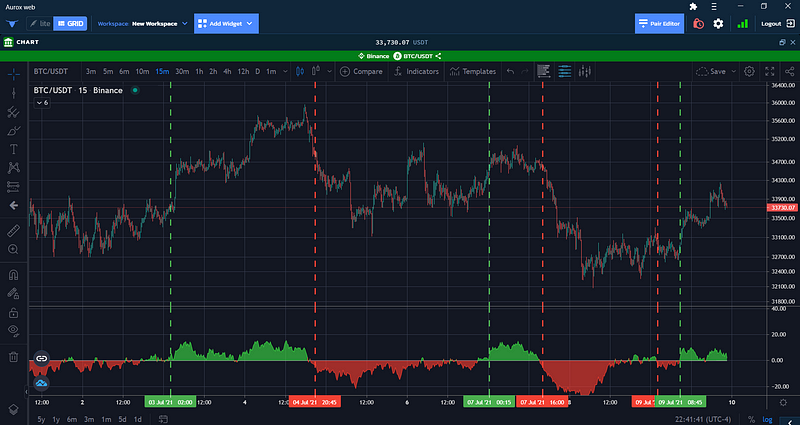
- Long when you have a candle or two confirming that the money flow is green and getting stronger.
- Short when you have a candle or two confirming the money flow is red and getting stronger.
Simple!
Stochastic RSI
This indicator is useful in that you can simply buy with the Stoch RSI crosses.
- Long (or close short): When the Stoch RSI is low, crosses to go up, and turns blue.
- Short (or close long): When the Stoch RSI is high and crosses to go down, and turns purple.
This can be seen below on the 4hr chart.
Cypher DBSI
Cipher DBSI (Dual band Strength Index) measures momentum and displays whether the bulls, or the bears are winning the market battle. By default, the indicator settings populates with columns. Switching the settings from columns to “Area” can help you visualize the changes and strength a little better.
Other symbols to pay attention to are the red and blue circles.
- Red means possible sell signal
- Blue a possible buy signal.
- Orange X indicate there is a market battle between the bulls and the bears. With the markets lately, this seems to be a regular indicator so I typically would hide this to reduce the noise on the screen.
The rule for this is indicator:
- Only long when a blue dot has printed after the blue bullish momentum waves have been confirmed (1–2 candles)
- Only short when a red dot has printed after red bearish momentum waves have been confirmed.
In the screen shot below, you will find the 4hr chart from when we started our down trend.
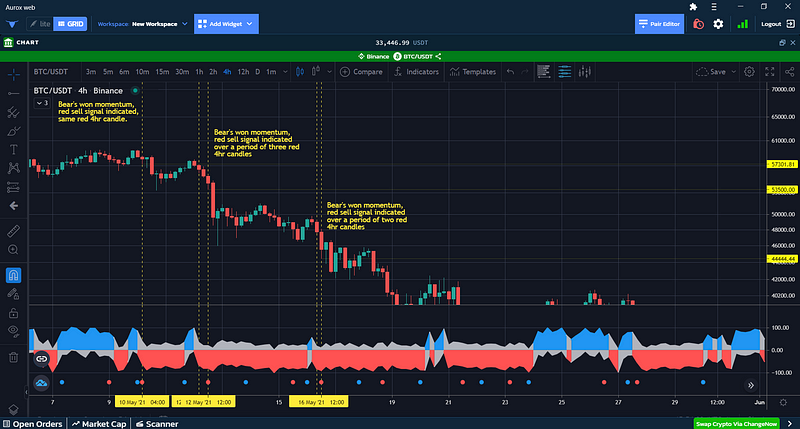
If you see the first dotted vertical line you see that the bulls lost their momentum, as the blue wave has now turned red, the candles are red, and a red possible sell circle has printed.
If you did not sell at that point, then let us look at the next set of dotted vertical lines.
Briefly, the bulls took control again, but quickly the momentum swung back in the bear’s favor. Multiple red 4hr candles, and then a red sell circle.
The candle after the signal’s candle closed was met with an 11% drop. If you continued to hold through that, you will see the same signals on the third set of vertical dashed lines, with more downside to follow.
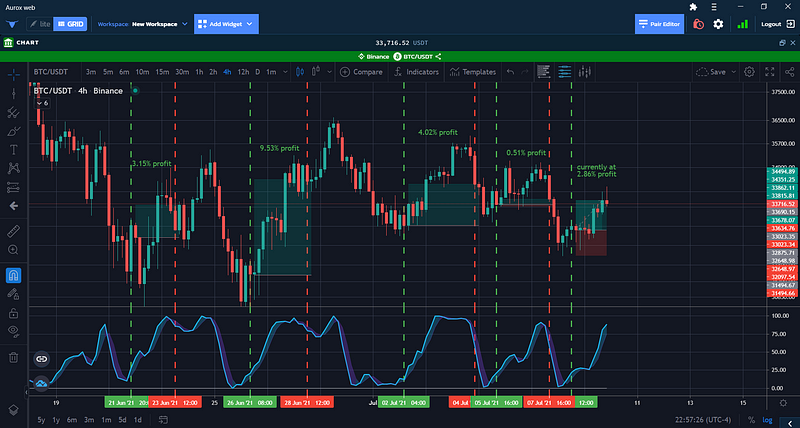
Now let us look at the recent price moment and some trades that could have been made using DBSI.
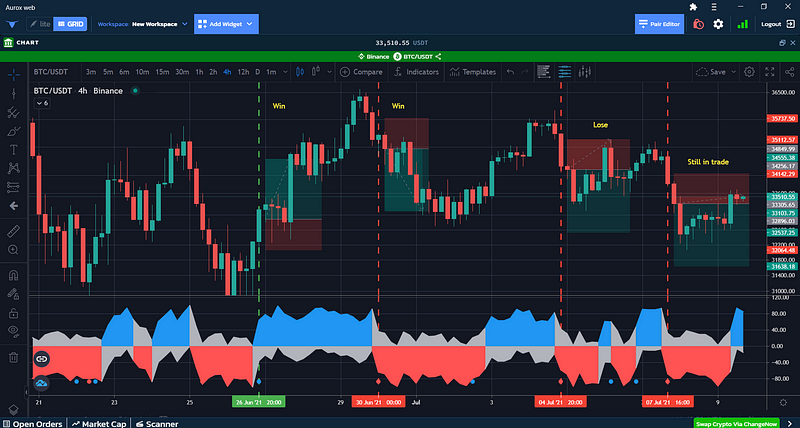
- For Stops we can afford to lose 2.5% or prior support, whichever is less.
- For Take Profit 5% target point.
As you can see here, there are 4 trades with just using this indicator following the rules above. The first two trades were wins, the third a loss, and the fourth trade we would still be in at the time of writing this.
The End
That’s all we have for these set of indicators. They are extremely powerful and a good tool to have in your arsenal for day trading. Some of them can be complex but by picking just a few strategies from above and sticking with them should allow you to make profitable decisions.
They’re all completely free @ Aurox
Always practice trading with fake money/paper trade.